
Global Birth Rates Are Falling — And the World Isn’t Ready
Fertility has declined nearly 50% since 1960 — reshaping economies and societies across the globe.
Over the past 60 years, the global birth rate has declined from 36.4 births per 1,000 people in 1960 to just 18.5 in 2020. This transformation is affecting labor markets, social systems, and national planning strategies.
According to the World Bank, key drivers include industrialization, urbanization, and expanded education access for women. South Korea’s fertility rate fell to just 0.72 in 2023 — the lowest globally.
Japan, Italy, and Germany also face sustained decline, while the U.S. saw birth rates drop from 14.4 in 2000 to 11.0 in 2022. Emerging markets are now beginning to follow this pattern.
A shrinking youth population leads to reduced workforce participation, economic slowdowns, and shifting priorities for education, infrastructure, and immigration policy.

Source: United Nations Population Division

Source: U.S. Centers for Disease Control and Prevention
Long-Term Forecasts and Societal Implications
UN projections suggest Japan and South Korea could see population declines of over 50% by 2100. This poses major economic and social challenges.
Sub-Saharan Africa remains an exception, with high fertility fueling population growth. Nigeria is expected to become the world’s third most populous country by 2050.
Countries are exploring solutions: France offers childcare subsidies; Sweden invests in parental leave; Singapore supports matchmaking and fertility programs. But no country has yet reversed the trend at scale.

Visual generated by StatMint using UN and World Bank forecasts
Wall Street Journal Insight
The Wall Street Journal reported in 2024 that declining birthrates are directly linked to projected GDP slowdowns across G7 countries.

Source: Wall Street Journal, 2024
Global Forecasted Birthrates by Country (2050)
StatMint presents a forecast map of expected fertility rates through 2050, combining UN, CDC, and World Bank data. Darker areas represent higher expected fertility.
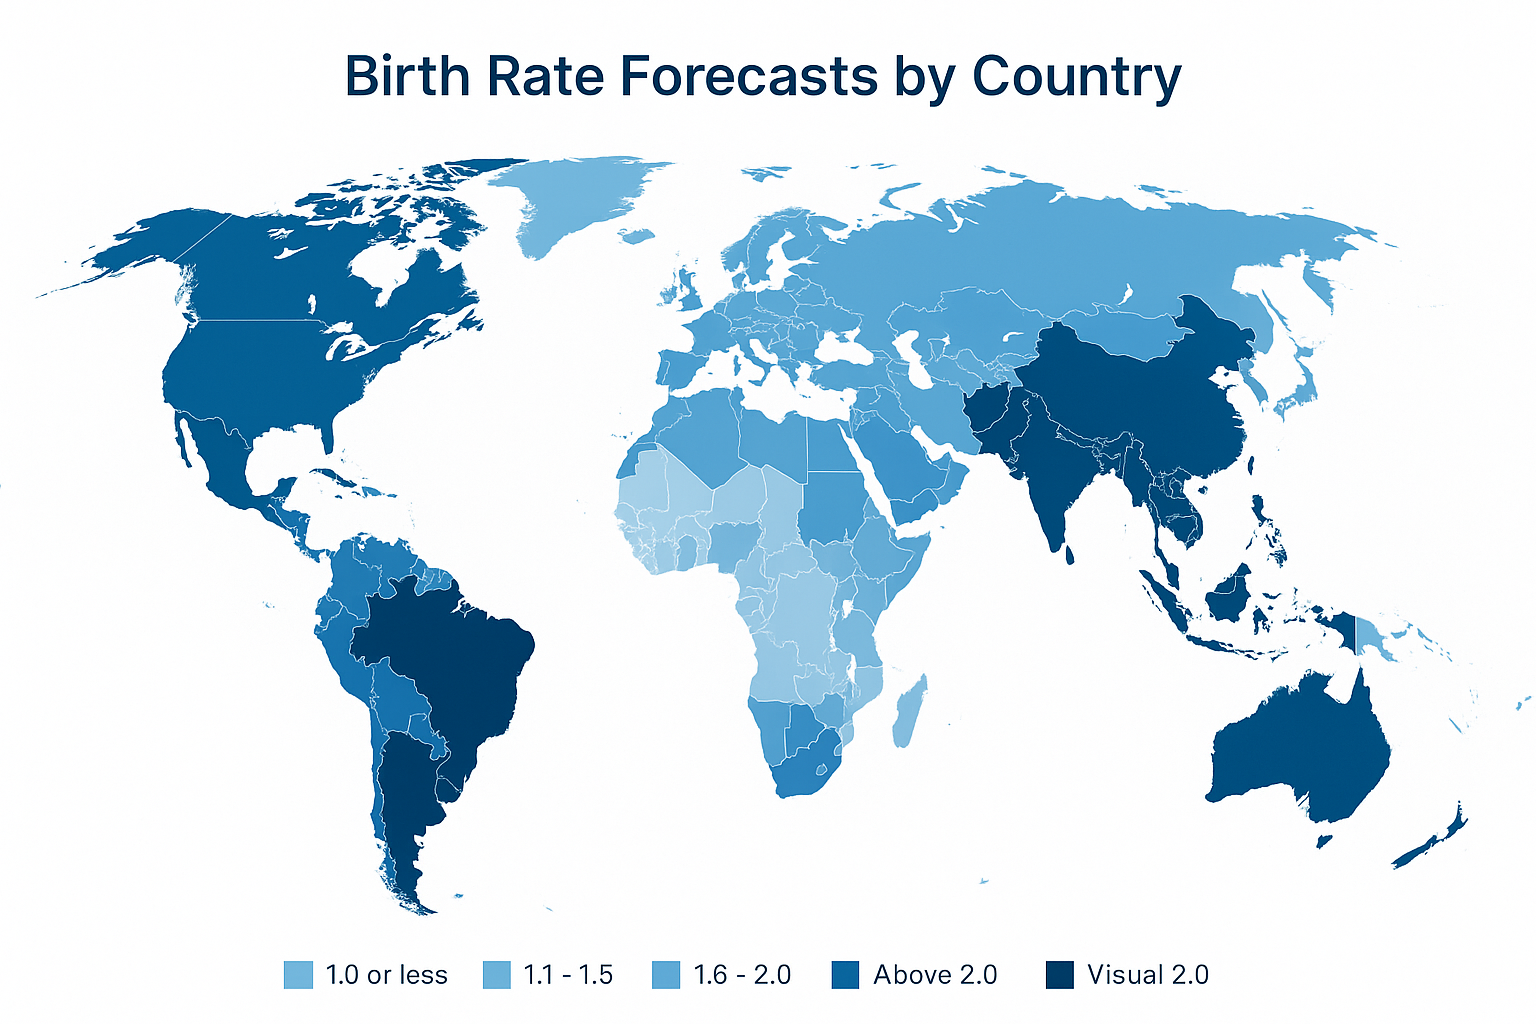
Source: StatMint Forecast • United Nations • CDC • World Bank